Space Allocation in London office fit outs.
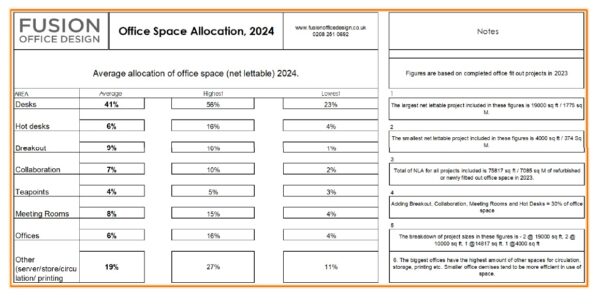
Fusion Office Design have used data from our completed office fit outs in London, during 2023, to compile a set of figures on the use of office space in London office fit outs. The table shows average figures for 7 key constituents typical across pretty much all of the completed office fit outs and refurbishment.

We haven’t compiled figures for any pre-pandemic years so direct comparison requires more research.
Office Space per person.
A figure that isn’t directly listed in the table concerns the footprint for a single person at a desk and the overall space per person. During our data compilation we looked at the area per desk. In years gone by the norm was to say 100 sq foot per person. This used a 1.6m desk as the standard, giving 40 sq foot per person. Added to this is all other spaces shared by everyone, or needed for operational purposes.
Taking the total number of desks (dedicated and hot desks) and the total amount of office space we get 67 sq foot per person. As the guide for taking new office space, or getting efficient use of existing offices, 67 sq ft per person is well below the previously accepted number.
However, there’s an observation we have made before, and worth repeating here. The last 2 years has seen a significant trend to reducing the amount of office space needed. Our opinion is that this will reverse in 2024 and staff will slowly commute more often, using the office 4 days a week. 67 sq ft is the number at the nadir. If office use increases we expect this figure will not allow for any growth in staff at desks and working in 3rd spaces. We might not see 100 sq ft per person again for some time, but 67 seems likely to be restrictive should organisations need to grow.
Open Plan Desks Vs 3rd Spaces.
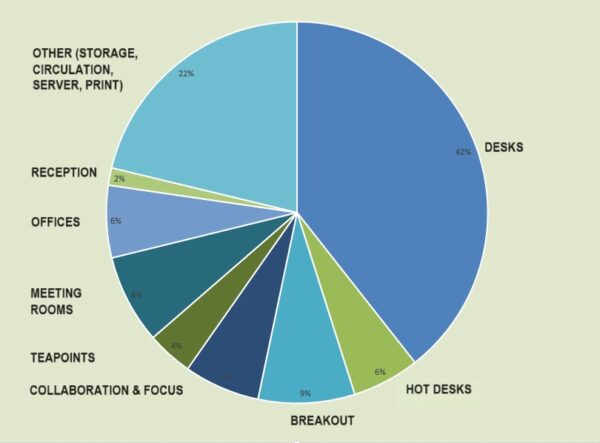
One aspect of the figures that may not be a surprise stems from the proportion of desks in open plan to what are called ‘3rd spaces’. These are areas that can be used as working spaces but aren’t conventional desks. Collaboration areas, breakout, hot desks and meeting rooms are all classed as undedicated…they’re for use by anyone and everyone. This is in contrast to a dedicated desk that is owned by an individual, even where a clear desk policy is in place. The ratio is 41% of office space for desks compared to 30% of the office used for 3rd spaces.
A high level view is 41% for desks, 30% for 3rd spaces and 29% for anything else (reception, storage, circulation, teapoints, server room). Simplifying the numbers for space allocation in London office fit outs to 40:30:30 gives an easy rule of thumb as a starting point.
Not all offices confirm to the norm.
Of course average figures can hide the variation between individual office fit-outs. With a range between 56% at the highest and 23% at the lowest for open plan desk space there’s a distinct difference between use of space. The highest figure relates to a high density co-working office that has shared meeting and breakout. The lowest figure is for a central London office where the space is mainly used for senior leadership with the bulk of staff at an office several hundred miles away in the west of England.
The hot desk space-range includes an organisation with a high proportion of staff working mostly at client sites. A significant number of desks are used by staff who might visit their head office once or twice a month.
Office Teapoints and Receptions.
Across all the figures, averages were only a totally reliable indicator for teapoints and receptions. There isn’t much variance on use of space for these two office fit-out spaces and the average figures are a good indicator. A footnote on teapoints…our figures separate any space given over to adjacent square footage with furniture that can be used for collab or breakout purposes.
The 40:30:30 office layout might not apply precisely to many fit-outs but could be a useful reference point when evaluating a fit-out space plan.
There is a mea culpa on the numbers in the table. Lots of zones in the office are furnished for multiple roles. A staff kitchen area can also double as a collab space. Breakout areas can be used at lunchtimes for eating areas. In compiling the numbers we’ve had to designate some multi-use areas within the fit-out as either one thing or another. A bit arbitrary but the only way to avoid double counting. The principle was to classify a space based on its primary role.
For more data derived from our portfolio of completed London office interiors click here to see figures on the cost of an office fit out in London.
To receive the breakdown of space allocation please get in touch and we’ll happily email the table, above, as a document.


